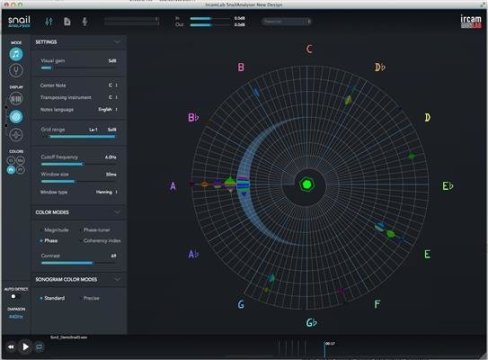
Screen capture of SnailAnalyser-Tuner.
A sound is an acoustic vibration in air. This vibration, or signal, is composed of oscillations having different amplitudes and frequencies that together form the "sound spectrum." Standard sound spectra analyzers display amplitude plots corresponding to sound volume, as a function of frequency, i.e. the number of vibrations per second. For a standard analyzer, these plots come from signal processing.
These analyzers extract the sound amplitudes and frequencies, giving information on the oscillations that make up the sounds. For example, for an audio signal with a frequency of 440 Hz[3], when this signal is processed over a short period there is an energy peak at 440 Hz. But the broader and less precise this peak is, the shorter the analysis period. This is what is known as "time-frequency uncertainty." To reduce this problem and significantly improve frequency precision, the researchers have exploited a new index that discriminates another sound component: the "demodulated phase." It is constant over time so it gives information on good synchronization between a component of the original sound and each frequency analyzed. Their analyzer operates in an analogous manner to a multitude of stroboscopes, which would make the phase of the sound components immobile at the selected frequencies: only these immobile zones then need to be displayed, using a specific algorithm.
From this principle, the scientists developed this new algorithm intended to analyze all spectral sound components and represent this information visually. First using the "Snail" mode, the active zones of the spectral content are represented by light spots on a spiral frame: one rotation corresponds to one octave; the low notes are near the center of the spiral and the higher notes are further out; the tuning fork's frequency (440 Hz by default) is symbolized by one dense point on the frame. For each frequency analyzed, the amplitude is converted into loudness (a numeric value that represents the sound volume as perceived by human beings)[4], itself converted into level of brightness: if a component is twice as strong, the spot is twice as bright. The spot size increases as a function of the noise and quality of synchronization with the demodulated phase. Users can then adjust the fineness of spot location as a function of the target operation (tuning, visualization of the music, etc.). Extra information is indicated by colors, according to the modes chosen (volume, demodulated phase, etc.). Two additional modes will also be available. The "spectrogram" mode displays the active sound zones on a keyboard with a time scroll. The "tuner" mode shows a zoom around the component of a target selected note. What is more, for this target note, a unit is represented with the angle given by the demodulated phase: its rotation allows fine estimation of tuning quality (one rotation in 2 seconds means that the tuning defect is 0.5 Hz).
So the SnailAnalyser-Tuner improves analytical precision in an adjustable way, according to whether we want the music in tuning mode or visualisation mode, for example. This software program is particularly good at extracting stable components drowned in a disturbed environment (noise, spoken word, etc.) and facilitates tuning operations, including for slightly or substantiallly inharmonic sounds (a "bad" cord can be identified immediately) without losing precision. The SnailAnalyser-Tuner delivers new solutions for visualizing the sound spectrum with representation suited to perception, for tuning an instrument with high precision and for simultaneously probing the harmonic quality of the tuned note. Musicians can now reclaim and rediscover the world of sounds and vibrations with this interactive approach.
Notes:
[1] Patent FR 1455456 filed on May 7, 2014 in the name of CNRS, for which IRCAM holds the right to practice in the domain of musical acoustics.
[2] And in Los Angeles on January 21-22, 2016 at The NAMM Show.
[3] Hertz (symbol: Hz) is the international system (SI) unit of frequency. One Hertz is equivalent to one event per second (s-1 or 1/s).
[4] This corresponds to standard ISO 226:2003.
Story Source:
The above post is reprinted from materials provided by CNRS. Note: Materials may be edited for content and length.